
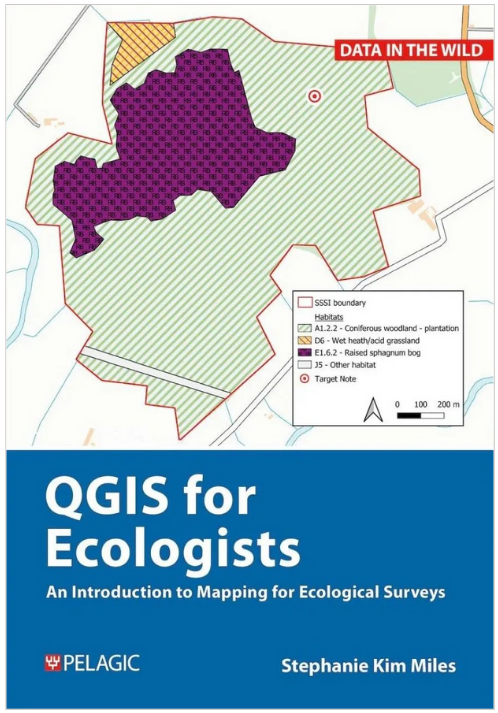
 QGIS for Ecologists teaches the fundamental stages of mapping land for ecological projects and reports and is ideal for those working in ecological consultancy and conservation, or for students with little to no training on the use of this software. Guiding the reader through the processes of basic survey mapping, aerial imagery, habitat mapping, designated sites and more, it provides a useful resource for anyone unfamiliar with the most accessible platform used to create maps for reports.

Stephanie Kim Miles works as a GIS Officer for the Bumblebee Conservation Trust, having previously worked as an ecological consultant specialising in ornithology. We recently had the opportunity to talk to Stephanie about how they first became interested in QGIS, the challenges they faced while writing a book on such a complex software and more.
Firstly, can you tell us a little about yourself and how you first became interested in QGIS?
I studied Environmental Science at Lancaster University for my undergraduate degree. When I graduated, it seemed to me that all the cool jobs wanted you to know Geographical Information Systems (GIS). At the time, GIS was not being taught as part of degree programmes, so this was not a skill I had. I was lucky enough to find a role with the promise of being taught GIS on the job and I began working for a multinational engineering and environmental consultancy. I learned how to create maps and spatial analyses for Environmental Impact Assessments (EIAs) for port expansions and offshore renewables projects, particularly wind farms. Whilst studying for my Masters in Conservation and Biodiversity at the University of Exeter, I tutored fellow students in the use of GIS. When working in an ecological consultancy, I performed field surveys for protected species and used QGIS software for the first time to map the results for reporting. I also became one of the tutors for the course: Beginners QGIS for Ecologists and Conservation Practitioners for the Chartered Institute of Ecology and Environmental Management (CIEEM). I am currently working for The Bumblebee Conservation Trust (BBCT) where I use QGIS to map and analyse spatial data. I use QGIS to support the monitoring and evaluation of bumblebee conservation projects and to map bumblebee records for BeeWalk, a citizen science recording scheme.
For those who might not know about this software, could you give us a brief overview of what QGIS is and its applications in relation to conservation?
QGIS, as with other GIS software, is a computer programme used to visualise, analyse and map any data with coordinates. You do not need to know how to write computer code as the interface uses a mouse to click through menus, like in familiar Microsoft Office applications, for example.
QGIS is free of charge making it accessible to those working in small consultancies and conservation charities. The software is open-source, meaning that anyone with the ability to code can write scripts called plugins to automate certain tasks. Fortunately, such coders exist within the ecological community! Particularly useful is the TomBio plugin written by Rich Burkmar and other contributors at the Forest Stewardship Council (FSC). The TomBio plugin enables you to import biological records and easily map them at a suitable scale for the data accuracy as points or grid squares at different scales (as you may have seen on the National Biodiversity Network (NBN)).
In ecological consultancy, you need to access the impact of works on the habitats and species present and suggest mitigations and improvements. In conservation, you need to be able to access the site condition prior to conservation interventions, during and after habitat improvements and/or species work have taken place. Both ecological consultancy and conservation use similar processes to do this, such as the Ecological Impact Assessment (EcIA) reporting process. This consists of an initial desk study to find existing ecological data and environmental designations, followed by field surveys, the findings of which are written up in a report. At every stage, GIS can be used to map and analyse the data to provide the information and visualisation required for reporting.
What inspired you to write this book for fellow ecologists?
While developing the teaching materials for CIEEM courses I found I was essentially creating a textbook. I have continued to teach QGIS to colleagues and trainees while working in conservation, becoming more and more aware that a textbook would be really useful for me and those I was teaching. I felt that publishing a book would enable me to train more people in the use of GIS for ecology and conservation than I could on a one-to-one or class basis. I think it is really important that as many ecologists and conservation practitioners as possible can use GIS, I believe every project can be improved by understanding where everything is in relation to each other and creating beautiful, accurate maps to show it.
This book starts with the basics of QGIS, working up to the creation of several types of maps. How did you decide on the breadth of this book and which tutorials to include??
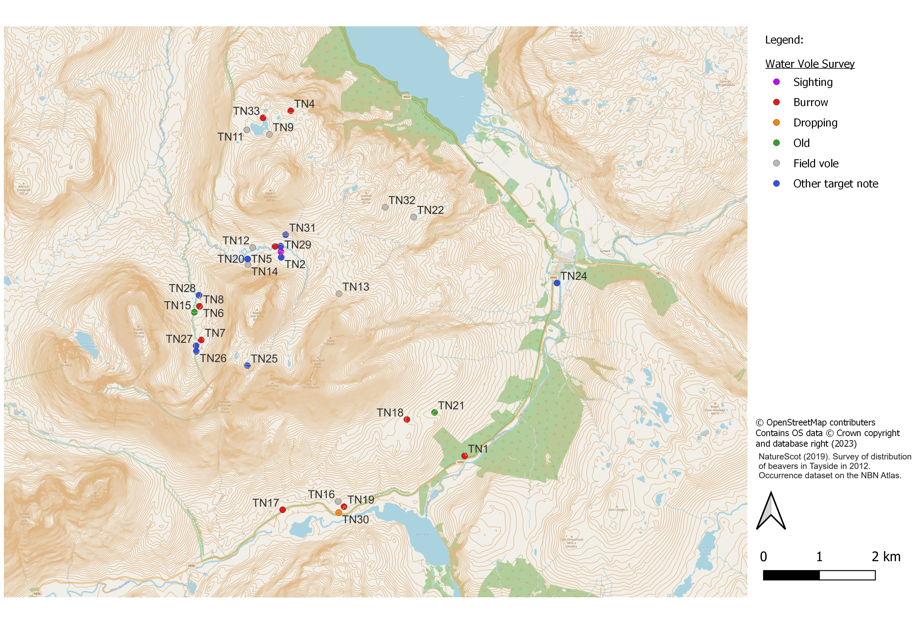
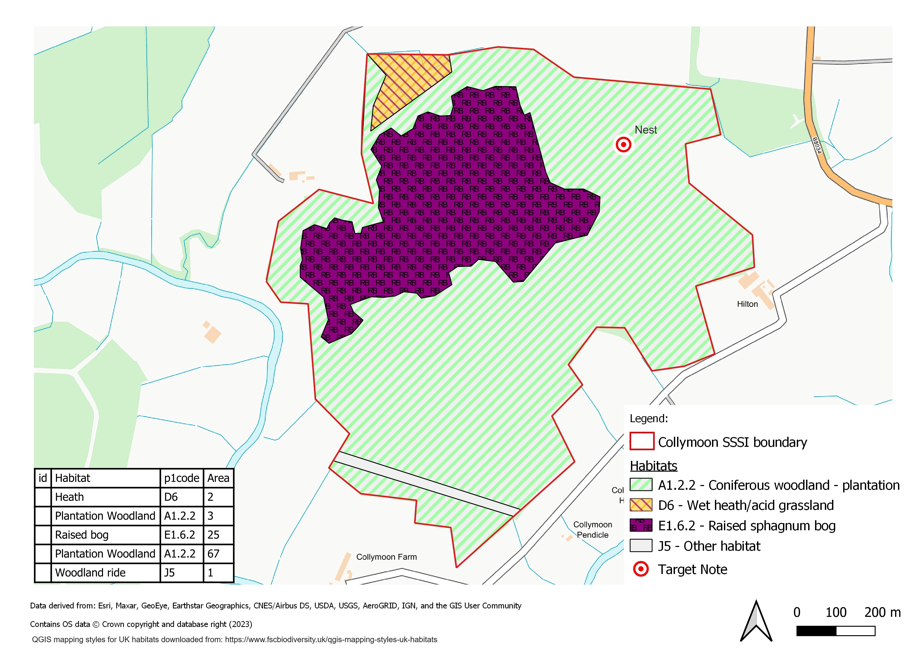
I chose the tutorials to cover maps I have most frequently needed to produce for ecological reporting: a basic survey map, an aerial imagery survey map, a designated sites map, a desk-study map, a protected species map and a Phase 1 habitat map. As part of this you use UK sites and data, learn how to download free-to-use maps and datasets, georeference images and import GPX files into QGIS. Once you have worked through the tutorials, workflows are provided that you can follow with your own sites and data. I hope that having this refresher to refer to means you can maintain GIS skills in your own workplace, without having to reread the entire book to remember what you need to do.
Did you face any challenges in creating an easily digestible guide for such complex software?
Yes! When I first started training others and began writing down instructions for creating maps, I found that I would often leave out certain steps I was very familiar with. In person, teaching a class or one-to-one, I was there to provide any additional steps I had not written down. I knew that in writing the book I would need to make very sure that I had not missed anything! To do so I have spent a number of years perfecting the tutorials and data used to make it as streamlined and clear as possible.
Another challenge has been the changing nature of data availability, sources and copyright, as well as software updates that all make the processes work slightly differently. I have worked hard to ensure, as much as possible, that the workflows will remain current even if external data sources change.
Chapters 5–11 contain exercises for readers to undertake to improve their understanding of the subject and enhance their learning experience. Can you briefly describe how you created these and explain why you feel practical exercises were important to include?
Part 1 includes Chapters 1–3 and provides a summary of the book, an introduction to myself and to QGIS. The practical Part 2 begins at Chapter 4 with instructions for downloading QGIS and the data needed for your first maps. The exercises for producing maps are in Chapters 5–11. Part 3 contains the answers to the exercises in Chapter 5–11. Part 4 is Chapter 12 with the workflows for each maps produced in Chapter 5–11, so you can easily refer back to how each map was made, without having to reread the exercises again.
I wanted to include exercises aimed at creating maps that ecologists need to produce for reports. As GIS is a practical skill, it was very important to me that, as soon as possible within the book, you are able to create your first map. I have found that it is important to be able to produce maps while learning the basics of GIS. This helps to build confidence in what you are doing and see the results of your learning quickly. I hope that making several types of map, starting simply and ending up with the most complex, makes it easy to follow and it is clear how you will apply the skills you are learning to your work.
Will you be working on any more projects like this in the future?
I hope to write a follow-on book about the use of QGIS and QField for data capture in the field using tablet devices.
QGIS for Ecologists is available to pre-order from the NHBS bookstore